The Waterways Report Card
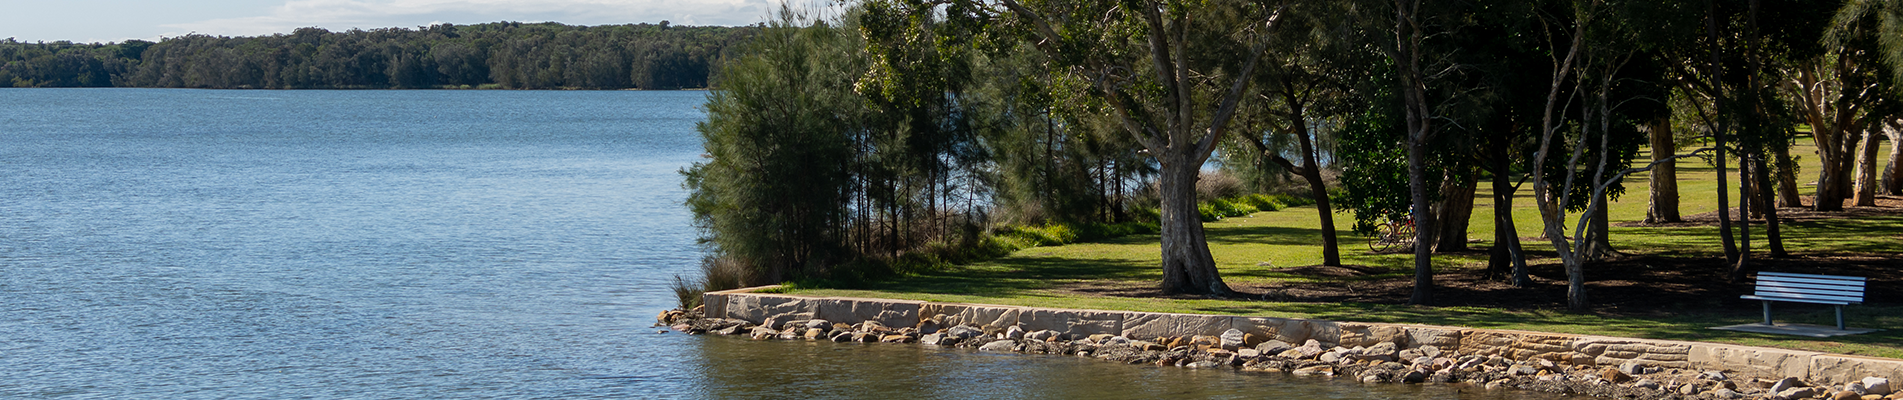
We all want to enjoy the beauty and biodiversity of our waterways. The Central Coast Council is devoted to closely monitoring the ecological health of our lakes, rivers, creeks and lagoons. We constantly evaluate the current condition of the lakes, measuring ongoing changes while also levelling out all the investment and on-ground works.
We define a healthy waterway as one that supports natural processes, is resilient to change, can recover from human impacts, and stays relatively stable and sustainable over long periods of time. Everyone also appreciates when their local lakes have clear water without too much algae and the ecosystem that supports a variety of plants and animals.
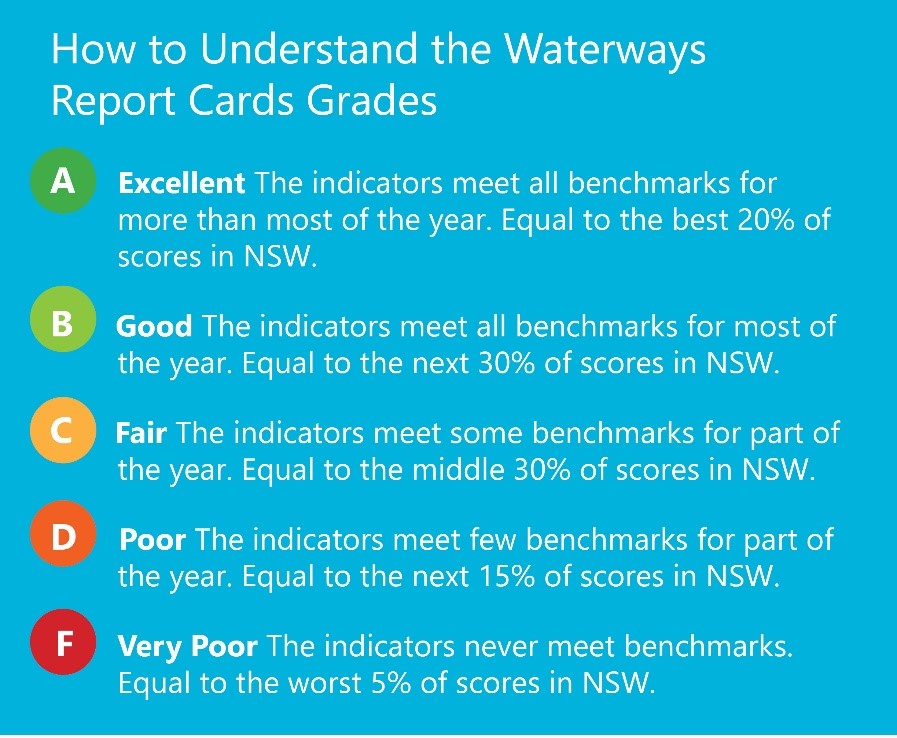
The Waterways Report Card is one of the tools that we use to measure the overall health of our estuary. It functions like a school report card, giving our waterways a score from A to F. This card meets the NSW Government’s Estuary Ecosystem Health Protocols and is consistent with other programs around the NSW. As a result, we can check how our estuaries perform compared to other waters in the state. The sampling program includes 36 locations across the Central Coast, with 16 just in Tuggerah Lakes.
Further report card information
Indicators of Water Quality
Turbidity
Turbidity, the amount of sediment or dirt suspended in the water, is a measure of water clarity or cloudiness. Elevated turbidity is caused by too much sand, silt, clay and microalgae suspended in the water. Long periods of high turbidity can negatively affect estuarine health.
Chlorophyll-a
Chlorophyll-a concentrations are an indicator of microalgae abundance in coastal and estuarine waters. High levels of chlorophyll-a indicate that there is a high input of nutrients – in other words, plenty of food – coming into the system. Over a long time, these nutrients can cause a decline in water quality.
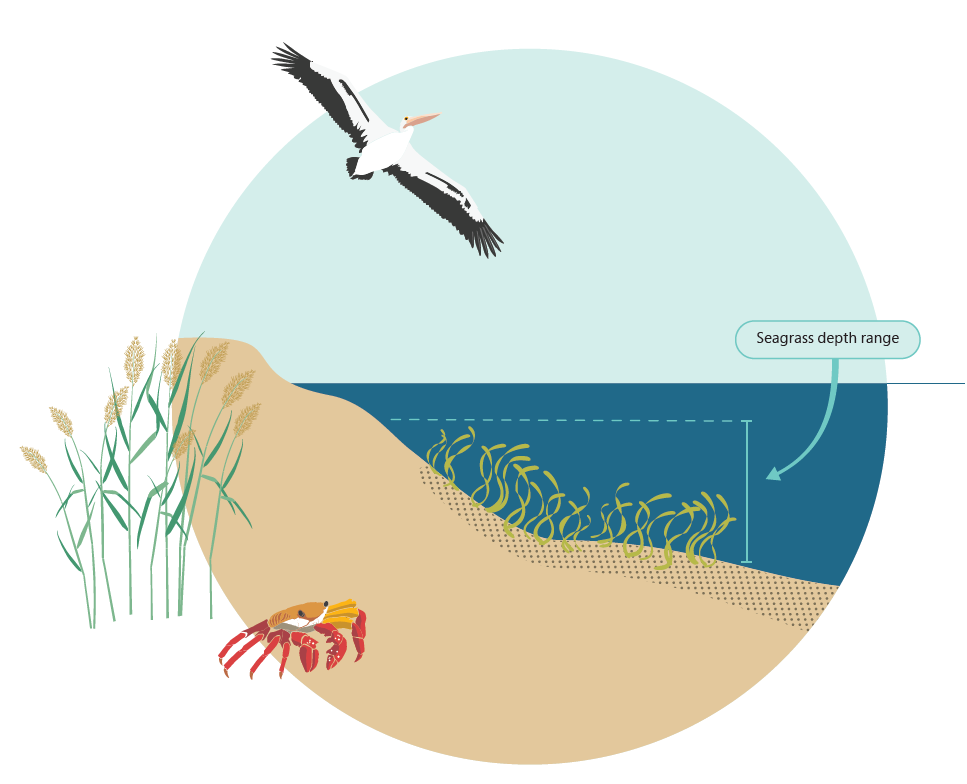
Seagrass depth range
Seagrass depth range is a biological indicator of water clarity over more extended periods of time. Seagrass grows slowly and depends on high water clarity, good access to sunlight and relatively low nutrient concentrations to survive and thrive.
When analysing turbidity, chlorophyll-a and seagrass levels from each of the sampling sites, we get to understand how the ecosystem is performing in response to the catchment’s pressure. Then, we can compare the results to the established trigger values for each type of the estuary. The water quality grade for each indicator is used to calculate an overall grade for each site. Sampling sites are selected to represent the surrounding area.
Healthy estuaries will generally have low levels of microalgae and turbidity and strong seagrass communities.
How to Calculate the Zone Score (ZS)
- First, we calculate the proportion of time that the measured values of the indicator stay outside adopted guideline limits. These are called Trigger Values.
- Then, we calculate how far the indicator stretches from the guidelines and if it approaches the worst measured scenario. This measure is called the Worst Expected Value (WEV).
- Then, we calculate the geometric mean of the non-compliance and distance scores to get a final score for that indicator for each zone.
- By averaging the scores for two indicators at each site, we arrive at the final Zone Score (ZS).
- Then, based on the ZS, we can grade the zone as A, B, C, D, or F.
-
 Dunkey Island
 -
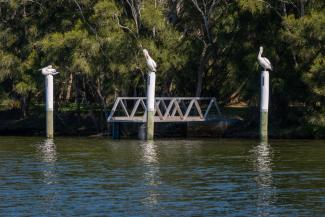 Pelicans on poles
 -
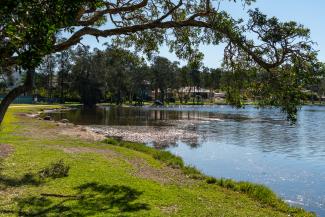 Green Point